
Proof, not promises
Real examples of how data governance, BI modernization, and analytics leadership create measurable business value — in margin, cost, decision speed, and time saved.
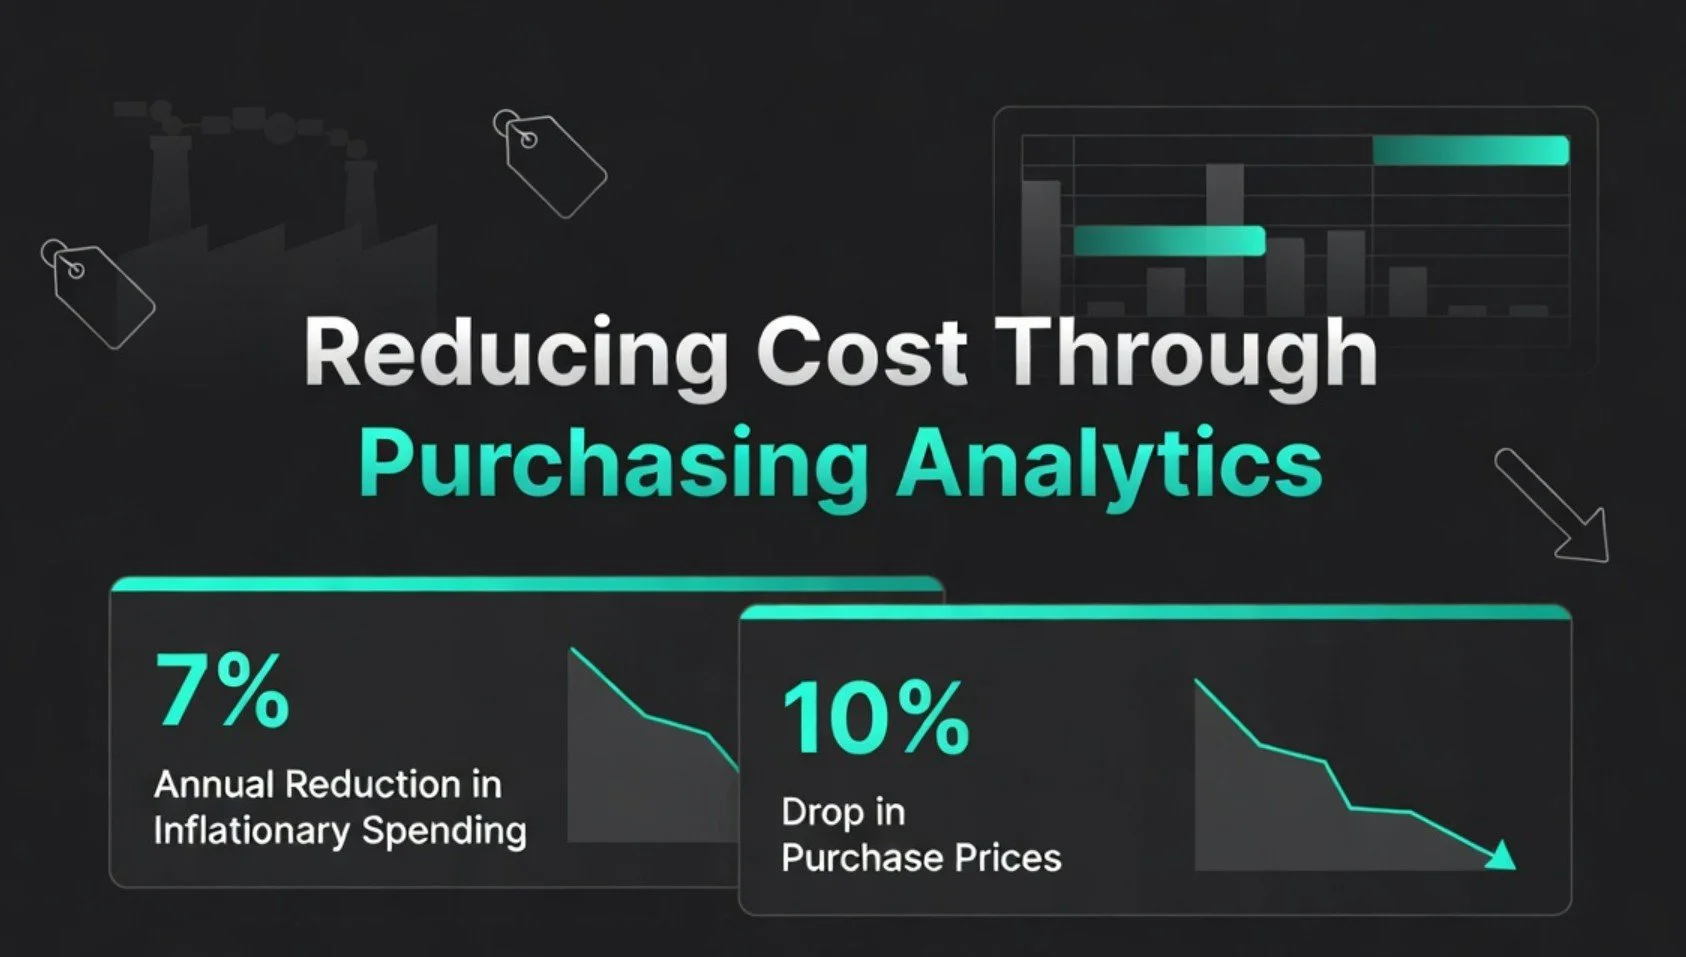
Using inflation and purchasing models to improve visibility and control.
The outcome: 7% annual reduction in inflationary spending. 10% drop in purchase prices.
Leadership knew inflationary pressure was eating into margins — but they couldn’t see exactly where or by how much. Without visibility into supplier performance and cost trends, purchasing decisions were being made on instinct rather than data.
By designing analytics models and dashboards focused on cost trends and supplier-related insights, the leadership team could see purchasing patterns clearly for the first time. That visibility translated directly into better negotiating positions, smarter sourcing decisions, and measurable cost reduction.
What made the difference:
Inflationary model built to track cost trends over time
Purchasing dashboard surfacing supplier-level performance
Analytics tied directly to negotiation and sourcing decisions
Team of data engineers and BI developers, business analysts coordinated around a single model
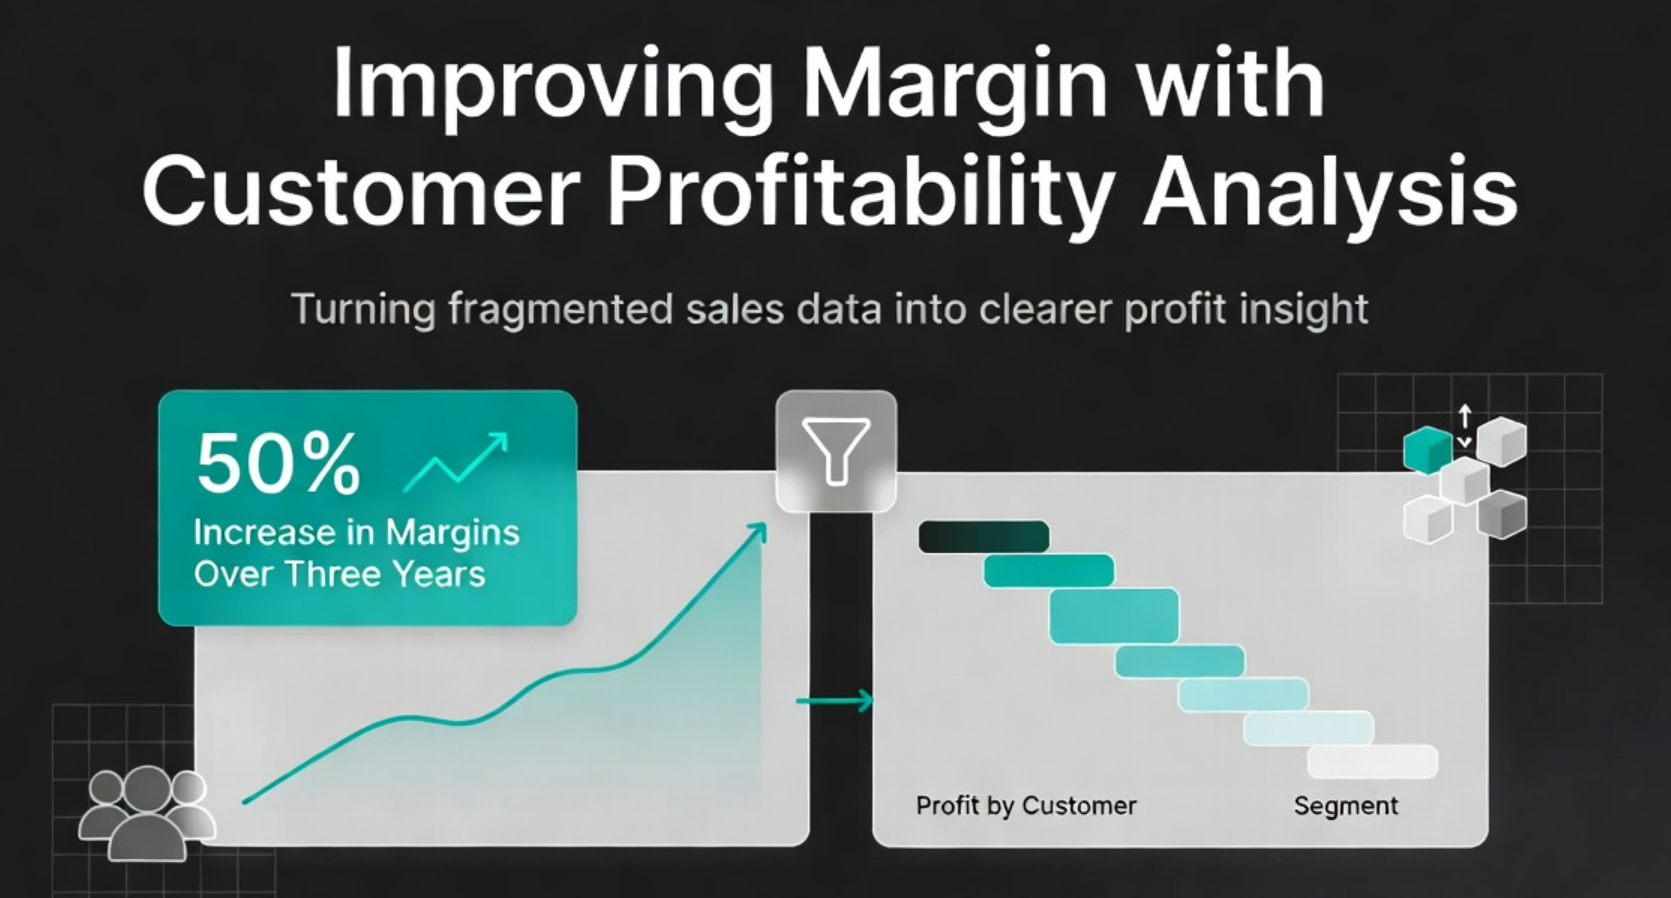
Turning fragmented sales and commercial data into clearer profit insight.
The outcome: 50% increase in margins over three years.
Fragmented commercial data across five business units made it nearly impossible to see where margins were growing and where they were quietly being lost. Customer profitability looked fine at the surface level — until you looked by customer, by channel, and by segment.
By building a consolidated customer profitability model and commercial sales data foundation across all five business units, leadership finally had an accurate view of profit at the level that actually drives pricing and commercial decisions.
What made the difference:
Consolidated customer profitability model built across five business units
Commercial sales data mart established as a single source of truth
Pricing and channel decisions supported by accurate margin data
Leadership visibility into where profit was being made and lost
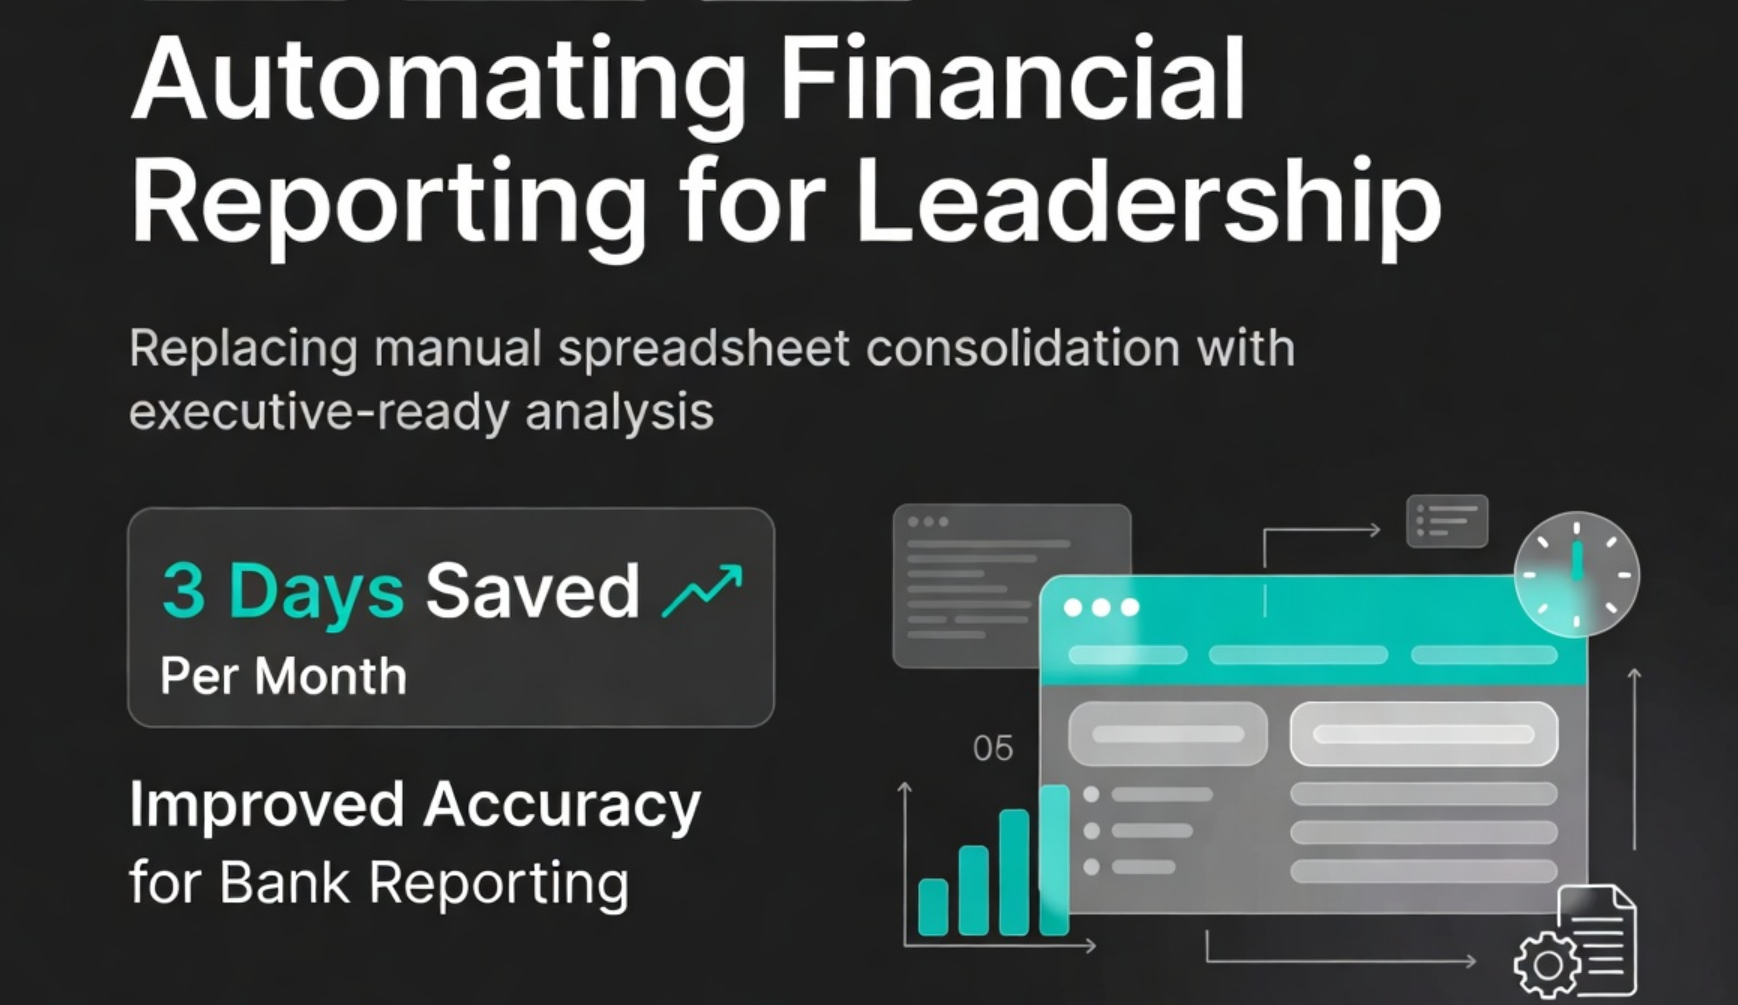
The outcome: 3 days saved per month. Improved accuracy for bank reporting.
The monthly close was a manual grind. Spreadsheet consolidation, data reconciliation, and reformatting — all before anything useful could reach the leadership team or the bank. The process was slow, error-prone, and entirely dependent on a small number of people who knew how it worked.
By designing and deploying an automated Asset Securitization financial reporting model, the monthly reporting cycle shortened dramatically. Accuracy improved, the dependency on manual processes was eliminated, and leadership got cleaner, faster access to the numbers they needed.
What made the difference:
Automated financial reporting model designed and deployed
Manual spreadsheet consolidation process eliminated
Reporting accuracy improved for bank reporting requirements
Monthly close cycle shortened by three full days
For a life sciences consulting engagement, the challenge was comparing drug side effect data across sources that used inconsistent terminology. Without a common framework, analysts couldn’t tell whether a pattern in the data reflected a likely true drug effect or simply an inconsistency in how claims were being coded and reported across different sources.
By developing a QlikView pharmacovigilance dashboard that aligned claims to preferred standard terms and used alternate states for side-by-side source comparison, analysts gained a reliable analytical framework for interpreting side effect signals.
What made the difference:
QlikView dashboard built to align claims to preferred standard terminology
Alternate states used for side-by-side comparison across data sources
Common analytical framework established across reporting sources
Signal interpretation improved for regulatory and clinical use
Industries behind the work.
🏭 Manufacturing
🔬 Life Sciences
📦 Distribution & Supply Chain
⚙️ Operations-Heavy SMBs
💰 Finance & Commercial Operations
These engagements span manufacturing, supply chain, finance, commercial operations, and life sciences. The common thread isn’t the industry — it’s the problem. Messy data, unclear ownership, inconsistent KPIs, and leadership teams that couldn’t fully trust what they were looking at.
Ready to write your own case study?
Every engagement starts the same way — a straight conversation about what’s not working and what better would look like. No pitch deck. No pressure.